Bike Fitting Stats & Thoughts
I broke down my bike fitting numbers for types of bikes, men vs women numbers, age groups and the 3 most common bike brands. Time frame - January to April (inclusive) of 2022.
In 2016, someone asked me how many bike fits I did in a year and what percentage of that was men vs women. I was a bit embarrassed to admit that I had absolutely no clue... As a business owner, I obviously kept track of my income and where it is coming from, but I never really kept close track of the quantity of bike fits per year, and while I knew I was fitting more men than women, I was not very clear on the actual numbers.
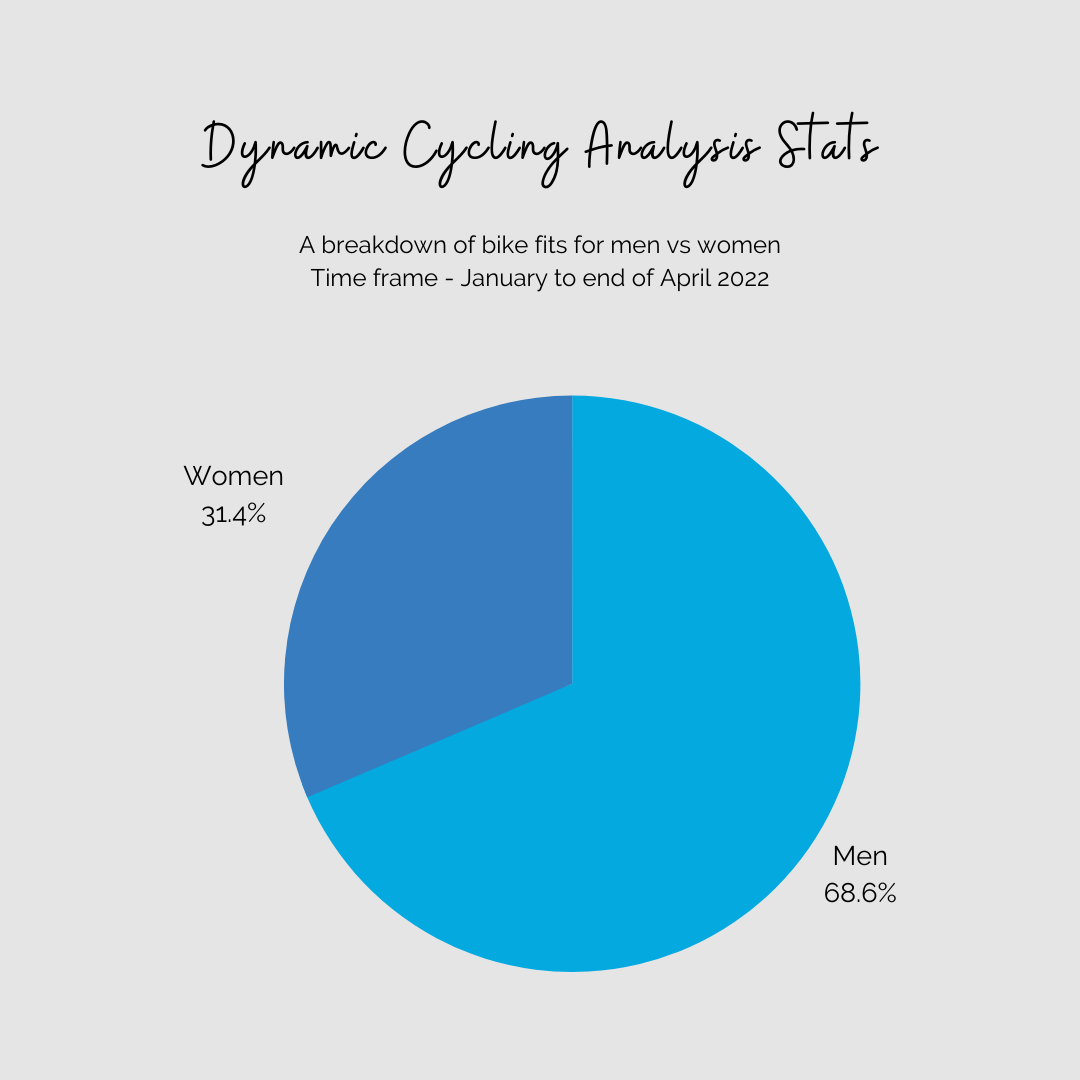
At the end of that year, I went back through my calendar and counted all appointments. The ratio of men vs women was 34% women and 66% men. I repeated that process every year since and while my overall volume went up, the percentage of men vs women stayed approximately the same. 2021 was my busiest year with 639 bike fitting appointments. Of these, 214 were with women and 425 with men - Still similar ratio at 33.5% women vs 66.5% men! This is certainly something I plan on discussing more in the hopes of closing that gap…
Fast forward to several weeks ago, when someone asked me what bike brand I see the most in the studio. Again, I didn’t have detailed numbers, so I decided to look into that, and while I was at it I gathered some additional information.
I am sharing the numbers because I find them interesting, but more importantly, I have never seen this kind of bike fitting data published anywhere and since the whole profession is still fairly new (and severely under-regulated, but that is a story for another time), I think having this information out there could potentially help the profession grow and evolve.
Keep in mind that these numbers are a quarterly summary from one fit studio (and one fitter), in Vancouver, BC (If you stumbled across this and do not know me and my work, you can read more about me here). I am sure other fit studio numbers vary greatly, and I would love to see more people post their statistics… In addition, perhaps it will also be useful for bike retailers and brands? I sure hope so!
The numbers below are for January, February, March and April of 2022. Moving forward, I plan on posting this kind of breakdown monthly, and then provide an annual summary.
Type of Bike & Gender Data
The chart below looks into the types of bikes I have worked on this year so far. A few relevant notes:
The pre-purchase numbers include fits done on the sizing/fit bike for those who wanted to get fitted before buying a bike. However, they do not include pre purchase consultations done with athletes I have worked with previously. I counted those consultations after creating the charts and will include that information starting in May. For those curious, I have done 8 pre purchase consultations with previous clients this year so far.
Cross and track bikes are not included as I have not fitted those this year (yet).
In cases where the bike will be used for various purposes (ie. gravel + bikepacking), I categorized it under the type of riding that particular athlete will be doing most often.
It’s quite obvious the road bike category is the largest one, and I don’t think it is a surprise to anyone due to the relatively static nature of the riding style: More repetitions in the same position can certainly cause some issues!
While I do believe the gap between road and gravel will close as time goes on (which will be interesting to observe), I would like to see that happen fairly quickly. Gravel riding is a bit more dynamic in nature compared to road, depending on the terrain the rider chooses to ride, so while you might be able to ‘get away’ with some discomfort by changing the position a bit more, it is not idea.
I do find it interesting that I have worked with more women on their MTB set up compared with men, and the same goes for hybrid bikes. I also find it interesting that the men vs women numbers for all categories except road and triathlon are relatively close, but could this be because they are smaller categories? I do want to see more pre-purchase appointments take place. I have far too many cases where the wrong bike and/or size was purchased - These expensive mistakes can be easily avoided.
I was initially planning on making comments on each riding category, but the reality is that it will turn this article into a very, very long read. Instead, over the next few months, I will share my thoughts on specific bike fitting considerations for each type of bike, starting with road vs gravel, in its own article with a few case studies. Stay tuned for that and be sure to subscribe for future editions!
Men vs Women
I think the numbers below speak for themselves. The men vs women breakdown has not changed much over the last 6 years or so, at least not in my studio. I have asked for other’s opinion on why that is the case several times and the answers I got were:
“I didn’t know bike fits were a thing”
“finding time away from work, family care duties”
“guilt due to being away for several hours”
“I’m just a recreational cyclist, I don’t need to spend money on this”
“guilt spending money on myself”
“general gender equality is a problem in cycling and this won’t change until the industry changes as a whole”
So much food for thought here. I can’t say I have the answers, but I am certainly going to continue striving towards providing an environment that feels safe and inclusive for all cyclists, regardless of their gender, ability level and the bike they ride and provide education and support when I can.
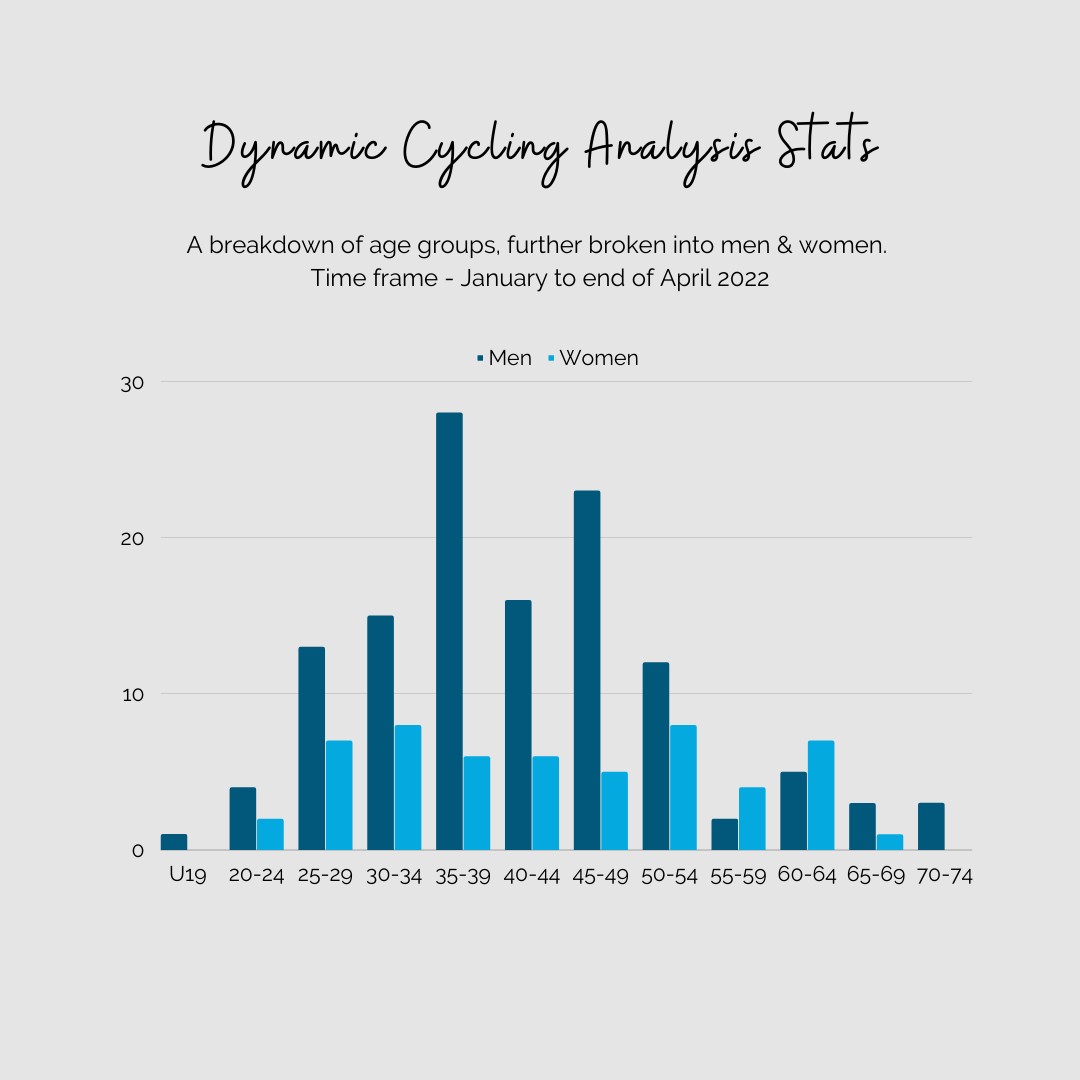
Age Group + Gender Data
Tying this to the information above, I think one could speculate that the larger gap between men and women in the 35-49 age groups could be tied to the following comments: “finding time away from work, family care duties” and “guilt due to being away for several hours”. Could this be due to more family and work obligations in those age groups? Shouldn’t men have those same obligations though? Again, I do not have the answers, but I would really love to hear thoughts from others based on their own experience and/or observations.
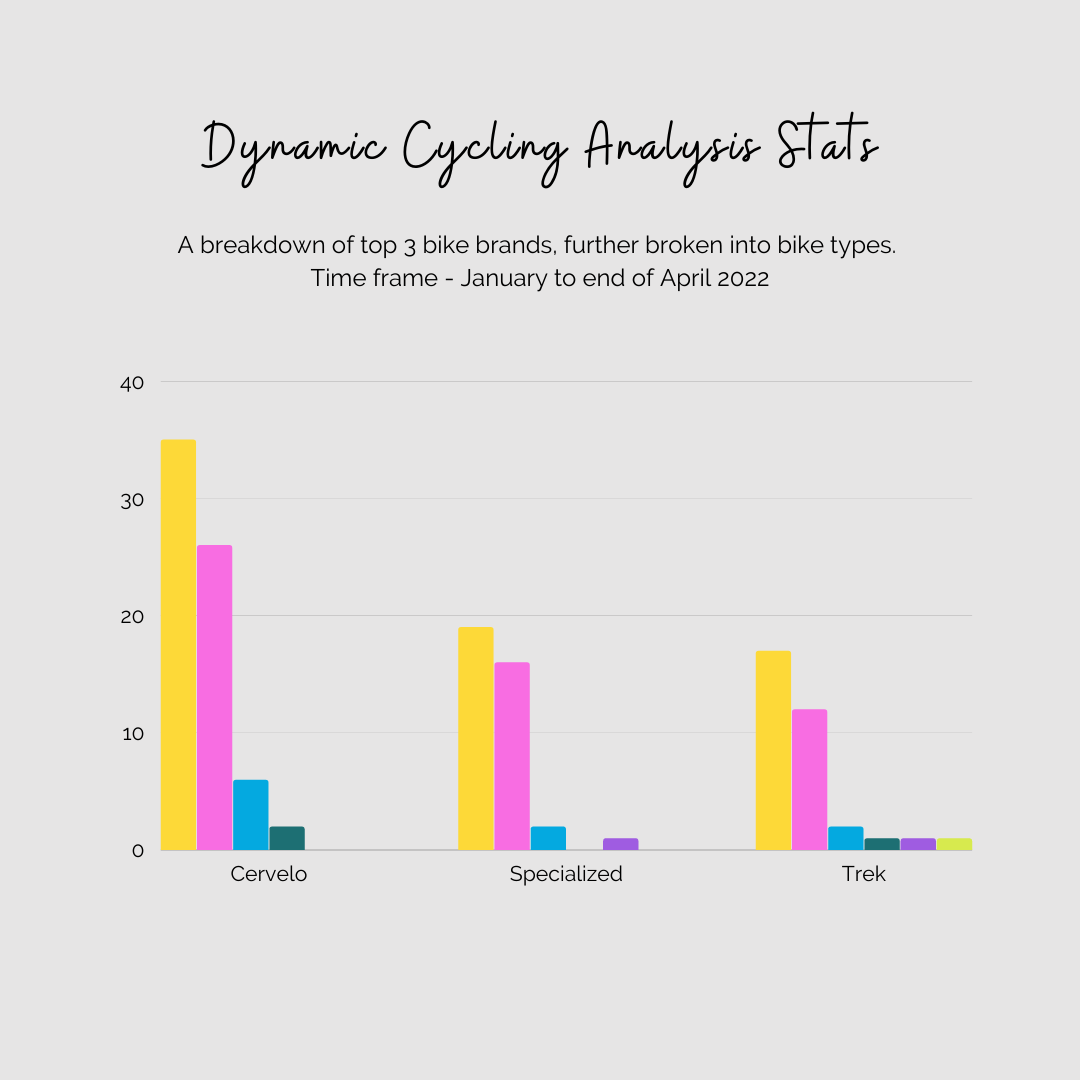
Top 3 Bike Brands
This is an interesting snapshot, but I am fairly certain it will not stay the same over the course of the year, and that it is likely tied to the current challenges in bike supply chain, availability, etc. I would be interested to see what this information would look like in other markets (ie. Europe), as I am sure it is different. It is interesting information to look into and keep track of none the less.
Well, there you have it. Some of my bike fitting stats from the last 4 months… Which is in part my ‘slower’ season, so I can’t wait to share the stats from the summer. I would love to hear your thoughts, so feel free to comment below! And if you are wondering why the chart titles mention ‘dynamic cycling analysis’ as opposed to bike fits, there is an explanation on my website…
This ‘newsletter’ a new format for me and I plan on offering both free and paid content. I am still working on the details, but wanted to share this article first, as there was a lot of interest when I posted some of the above charts on instagram. I will sort things out in the next week or so, but you can subscribe to the free posts below and share with those who might find it interesting.


